View the dashboard and reports
Goal
Read the manager dashboard (today's coverage) and the reports — roster reports and the plan-vs-actual variance report.
Who can do this
- Dashboard:
dashboard.view— every role except Employee. - Variance / reconciliation:
reconciliation.view— most roles (Planner, Manager, Supervisor, HR Admin, Viewer, HR Director, COO, System Administrator). - Roster reports:
roster.view— Planner, Manager, Supervisor, Viewer, System Administrator.
Before you start
- For coverage/variance to be meaningful, there must be a published roster and (for variance) attendance for the period.
Steps
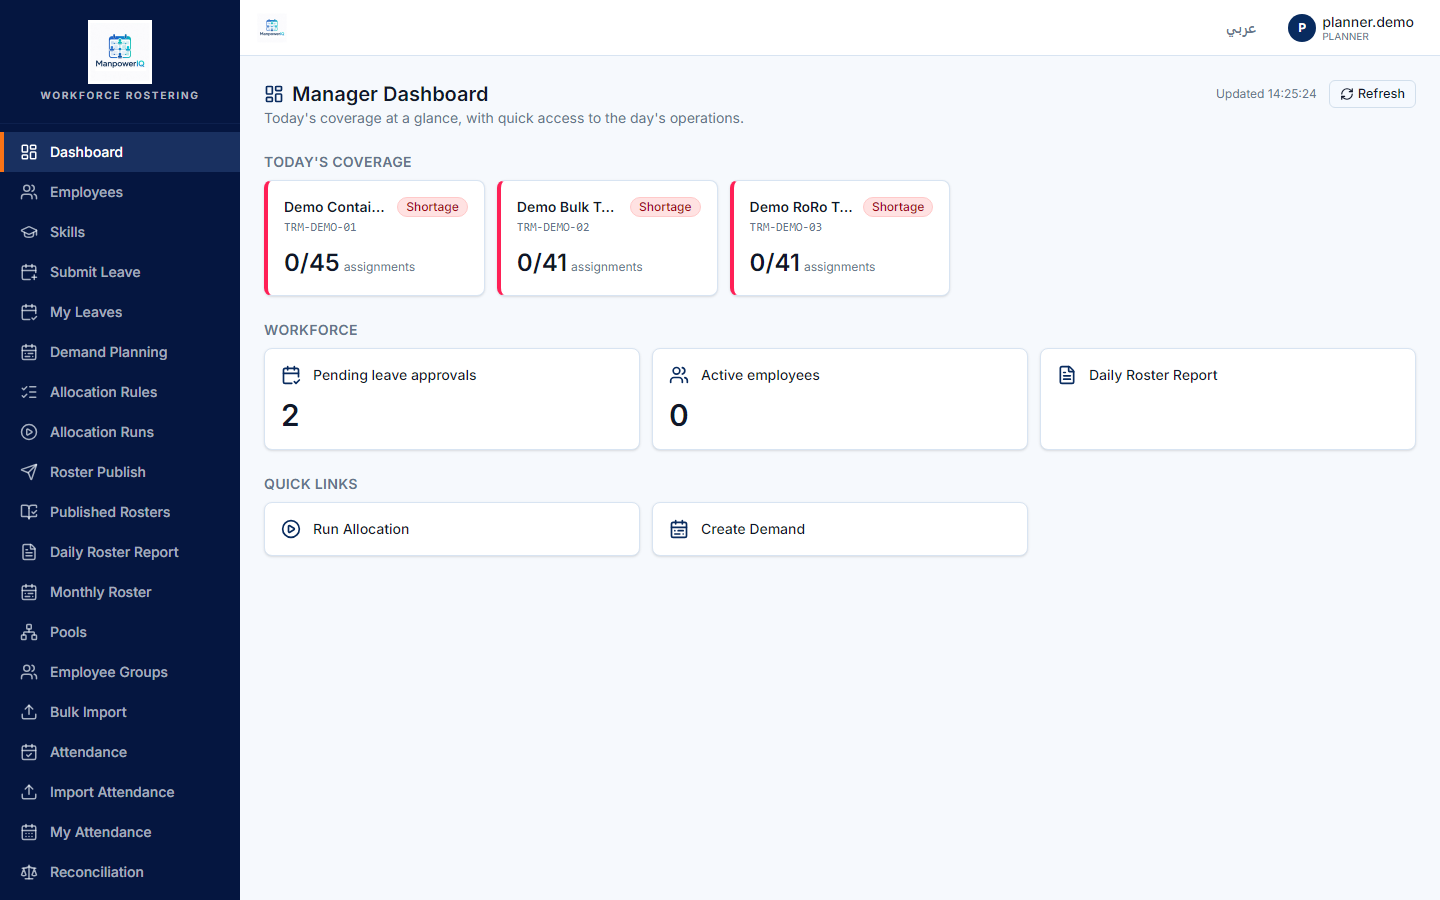
- Open the Dashboard (
/dashboard). It's a board of status tiles — per-terminal coverage (today's demand vs published headcount, marked Covered/Partial/Shortage), a pending-leave count, and an active-employee count. Refresh is a manual button.
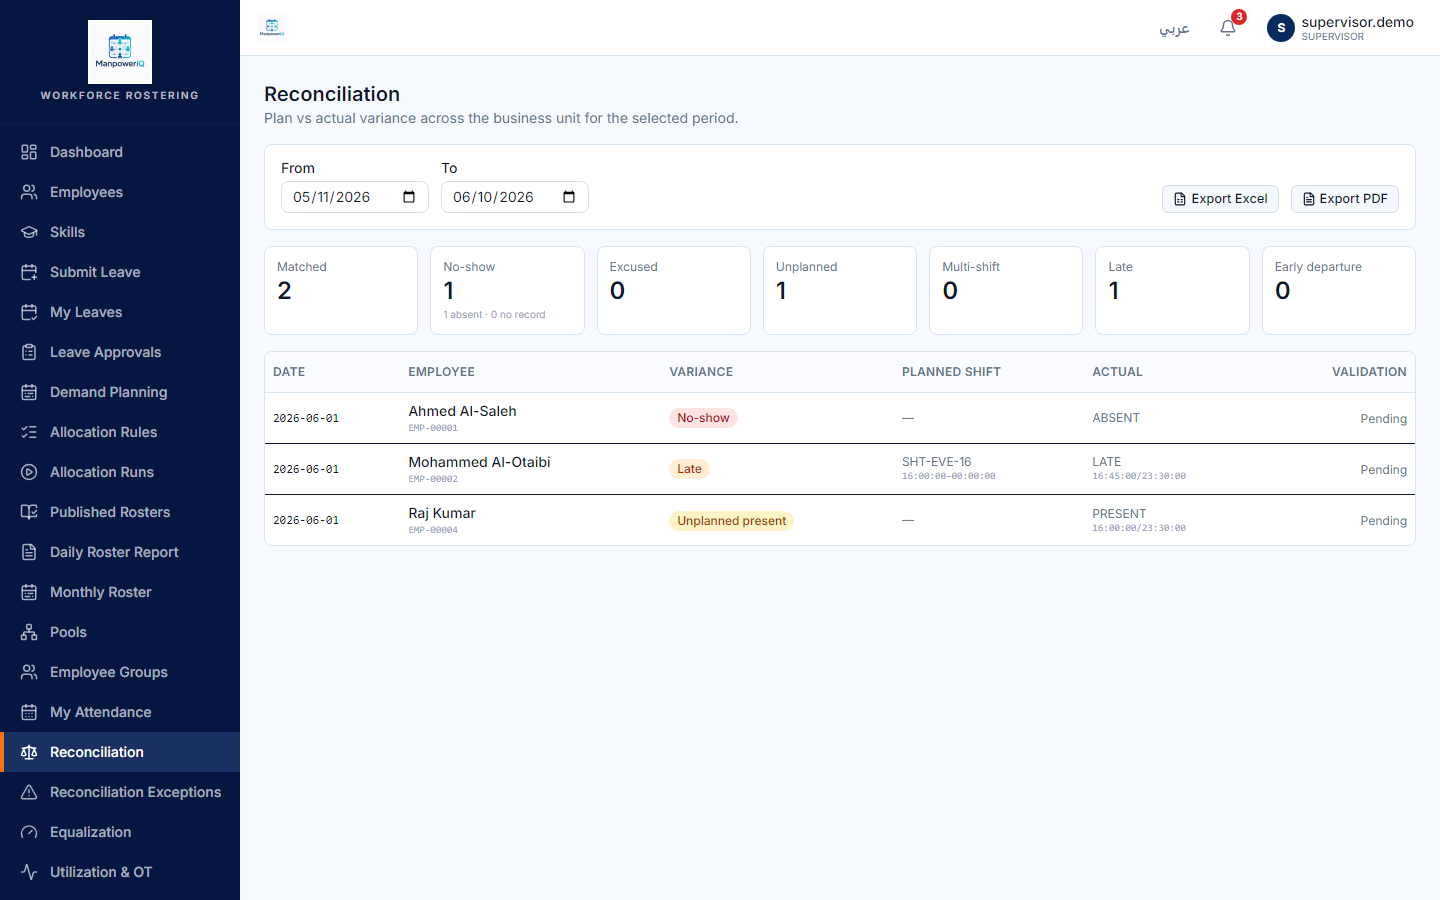
- For exceptions, open the Variance report (
/admin/reconciliation/variance), set the date range and terminal (e.g. 2026-06-01, Demo Container Terminal). It compares the planned roster to actual attendance.
- For who-worked-where, use the Daily and Monthly Roster reports (
/reports/daily-roster,/reports/monthly-roster) — downloadable as Excel or PDF.
What the system does
The dashboard and reports are thin read-only layers over the engines — they don't own data. Variance summarises planned-vs-actual exceptions; the roster reports render the published assignments. See Rosters & allocation runs.
What can block you
- There are no charts anywhere — the dashboard is numeric/status tiles, by design (no charting library is installed).
- The dashboard does not auto-refresh — click refresh to pull the latest.
- Coverage shows the first 5 terminals (by code) — informational, not a security limit; other terminals are reachable via the roster reports.
- Some reports are JSON-only: the Utilization and Equalization reports return data but have no Excel/PDF export yet (Daily/Monthly Roster and Variance do export).